
Slido is gradually rolling out a new user interface. If the below steps and visuals match what you are seeing within your account, then you are using the old interface and this article is for you. If not, please see this version.
Slido event analytics provide an easy way to view and analyze data collected throughout your event. They let you track participants’ engagement, discover popular topics and find the most influential participants. Use these insights to learn what resonates with your audience, build data reports and compare your events.
Here’s a quick how-to video:
In this article:
Access your Analytics
To see event data:
-
Log in to your Slido account and select your event
-
Click the Analytics tab
If you have multiple rooms in the event, you can either view analytics for the entire event or you can filter data by room. To filer analytics by room, click on All rooms and select a room or change the room in the top right corner.
We would recommend accessing event analytics after your event has finished. Simply open a past event and click on the Analytics tab.
Understand your Analytics
Analytics overview
At the top of your Analytics page, you will find a dashboard summarizing the most important statistics from your event.
Engaged participants
This section of the dashboard shows the level of participant engagement for your event overall.
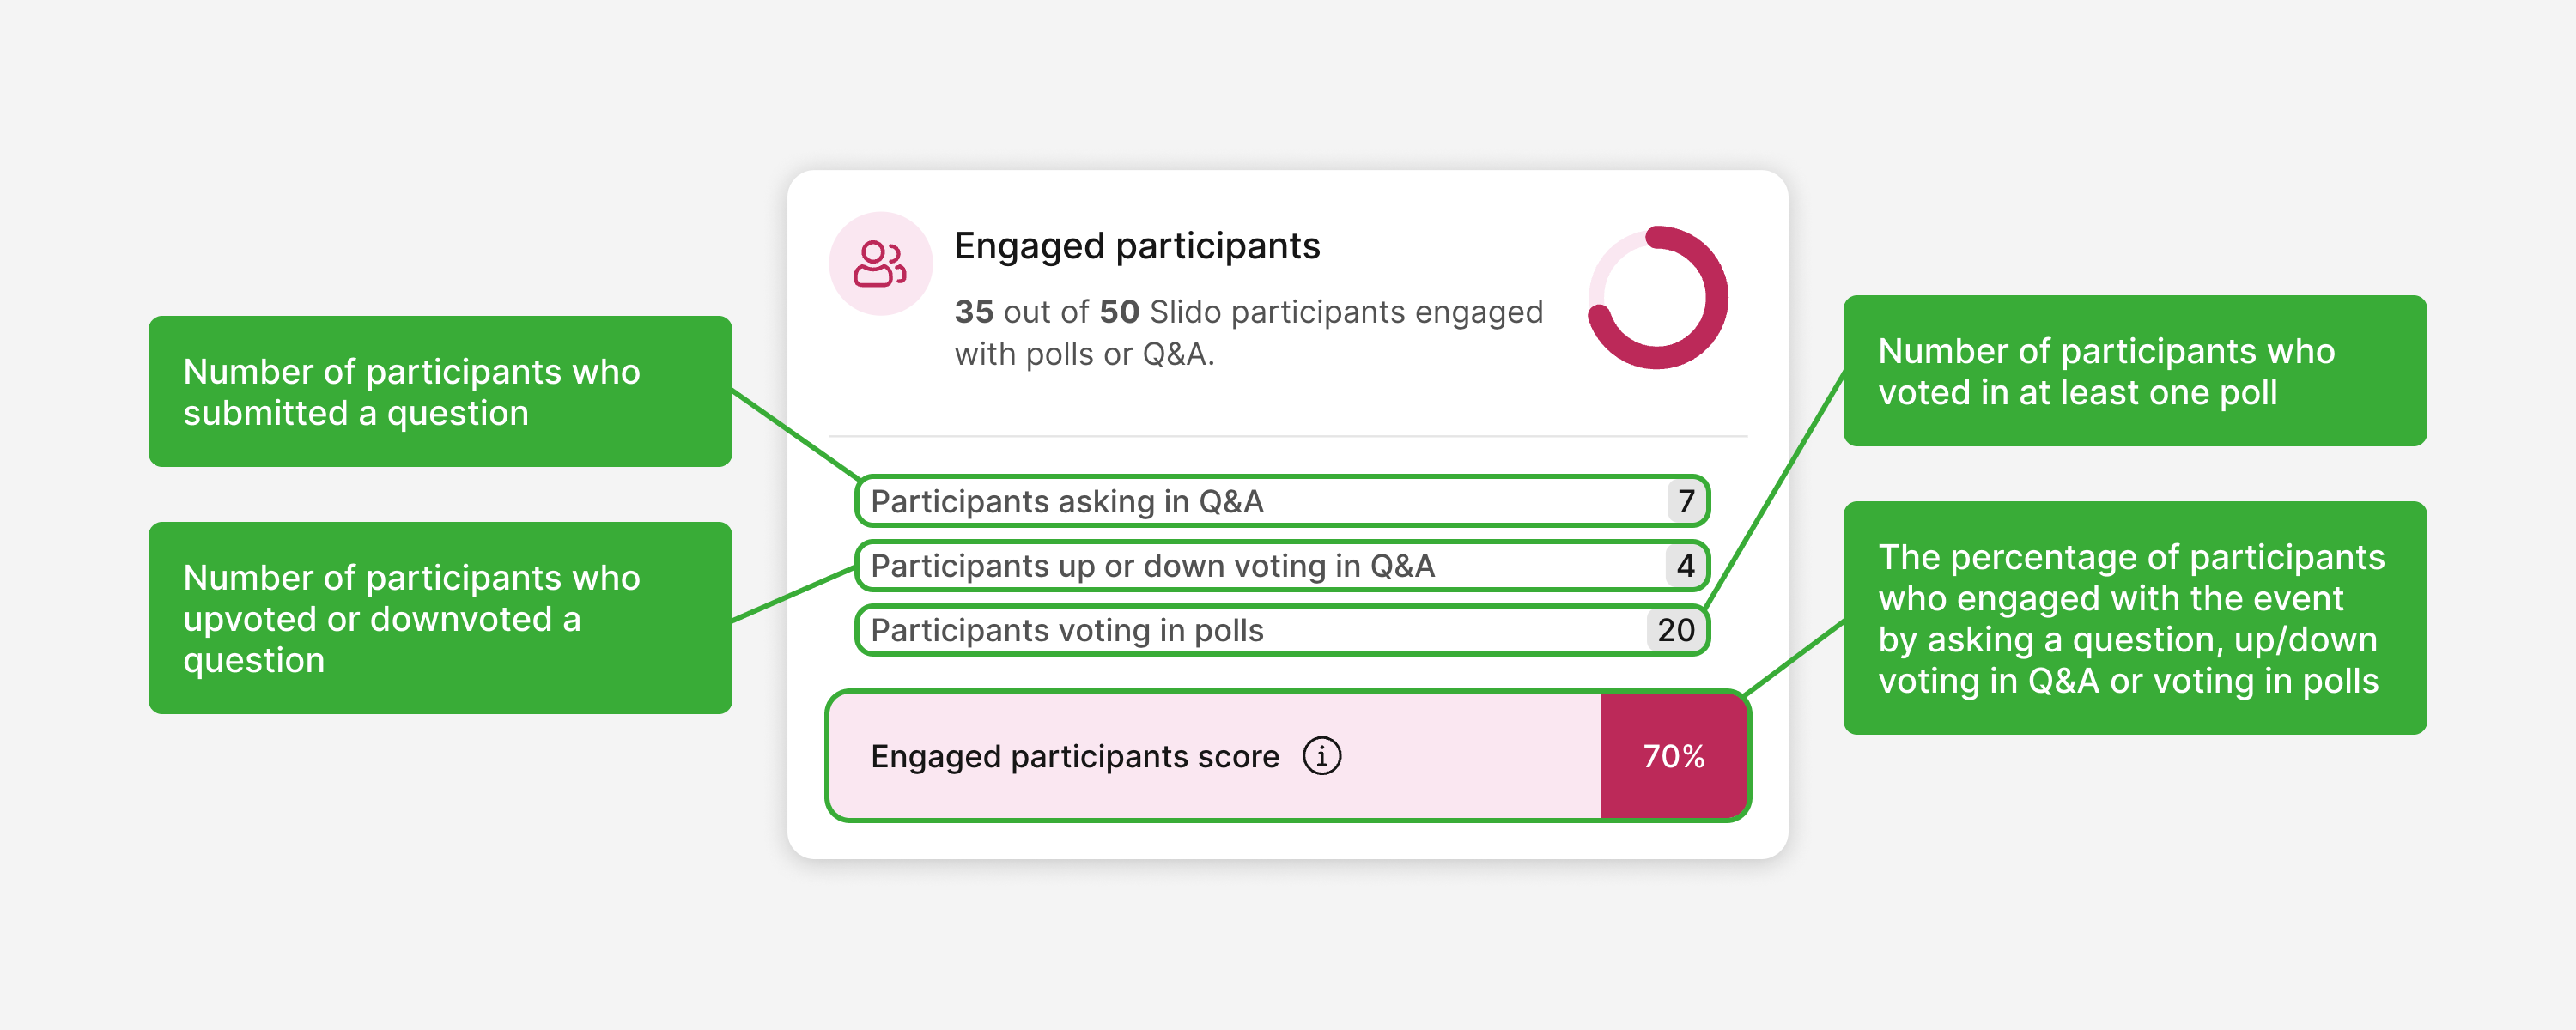
In this example, 7 participants submitted a question, 4 participants upvoted or downvoted a question, 20 participants voted in at least one poll and 70% of all joined participants engaged with the event.
Q&A engagement
This section of the dashboard shows how participants interacted with the Q&A.
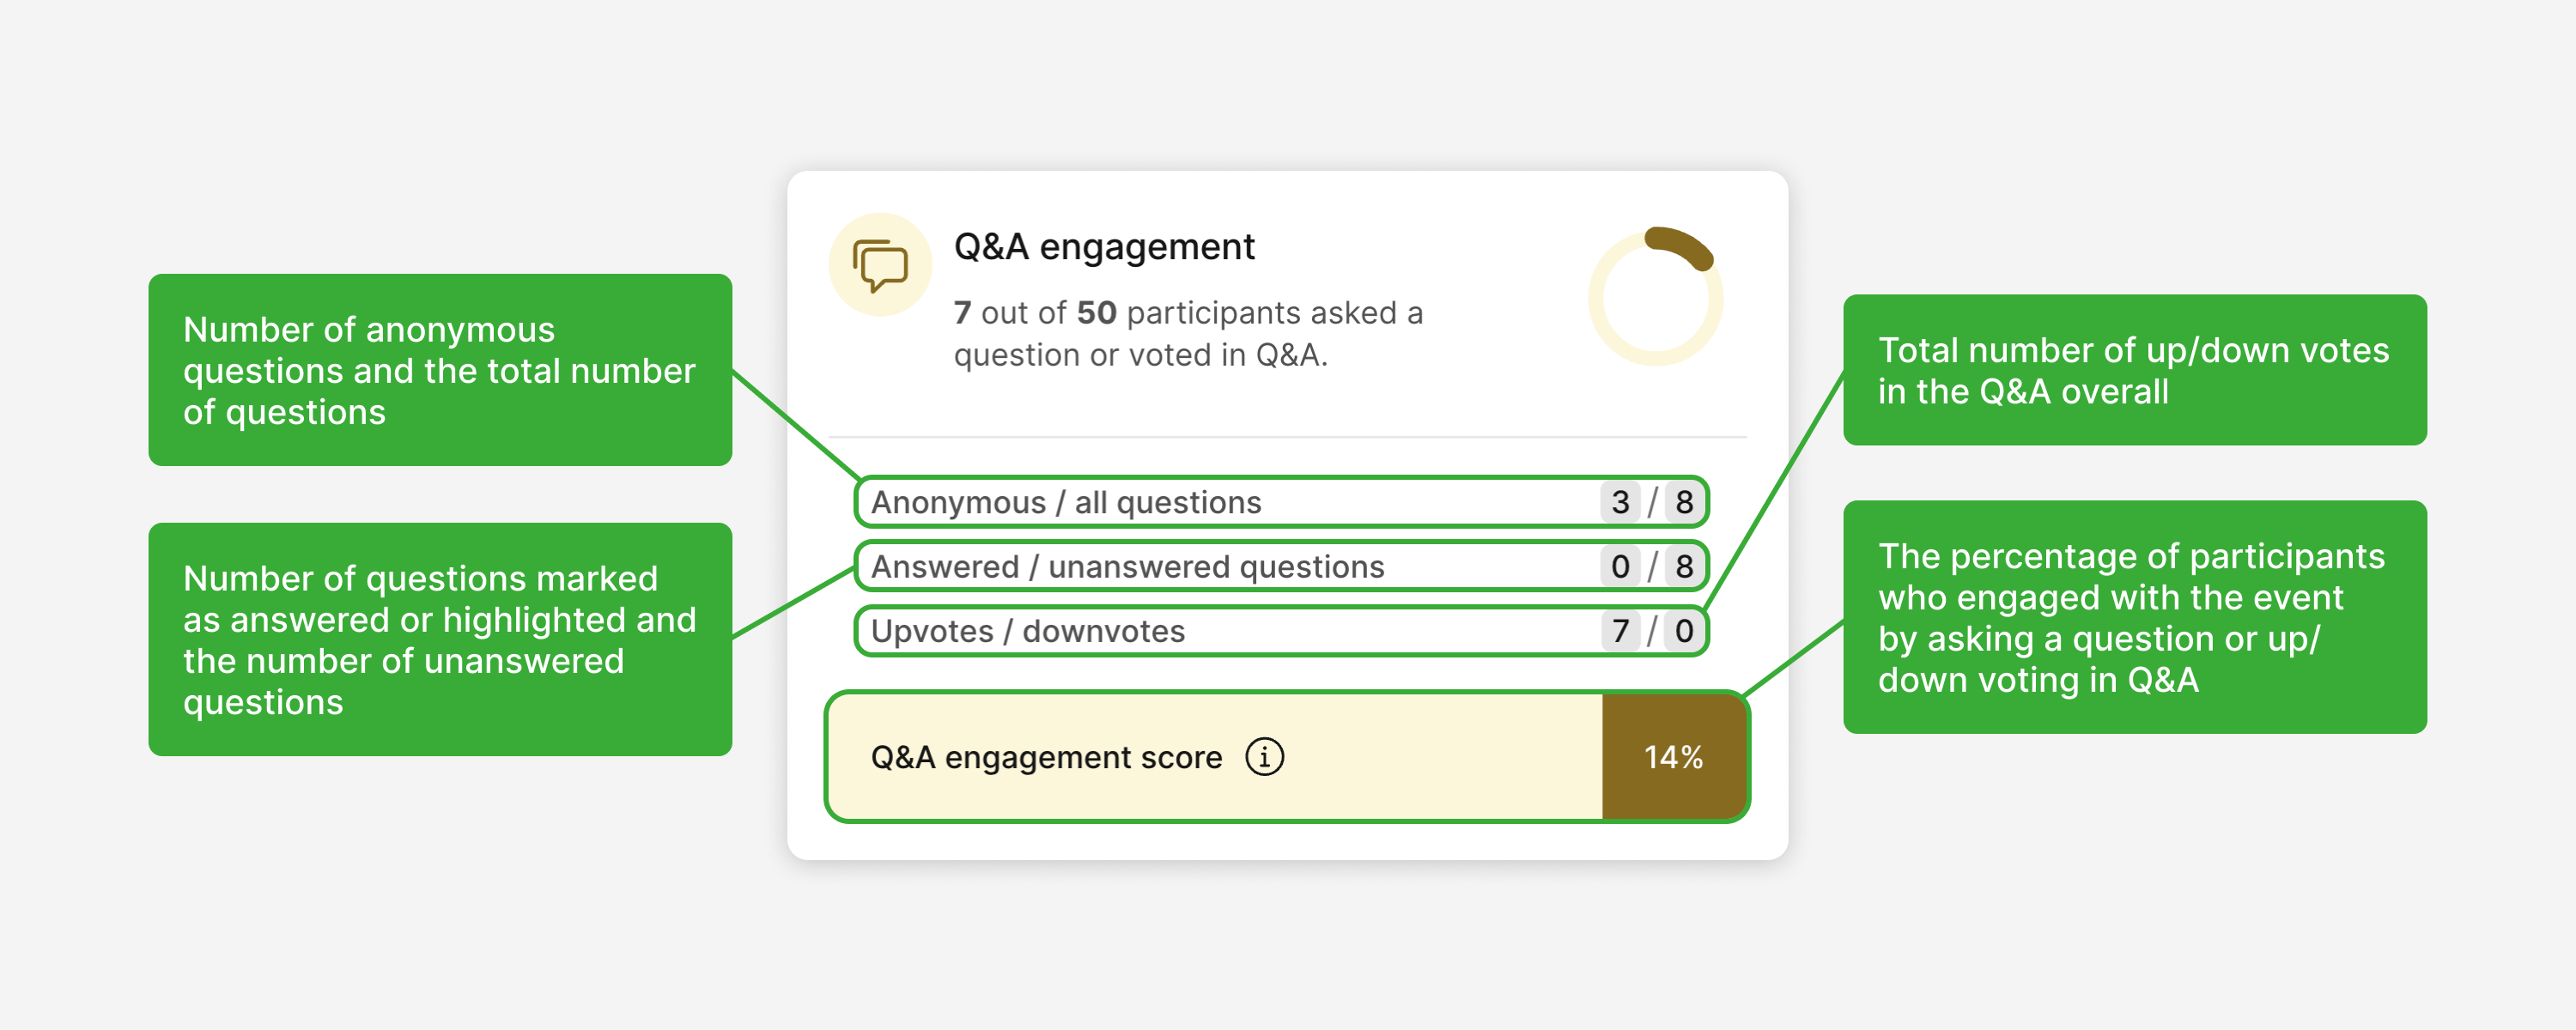
In this example, there were 3 anonymous questions and 8 questions in total. There were 0 questions marked as highlighted/answered. All 8 questions were unanswered. There was a total number of 7 upvotes and 0 downvotes. Out of all participants, only 14% engaged with the Q&A.
Poll engagement
This section of the dashboard shows how much participants interacted with polls in your event.
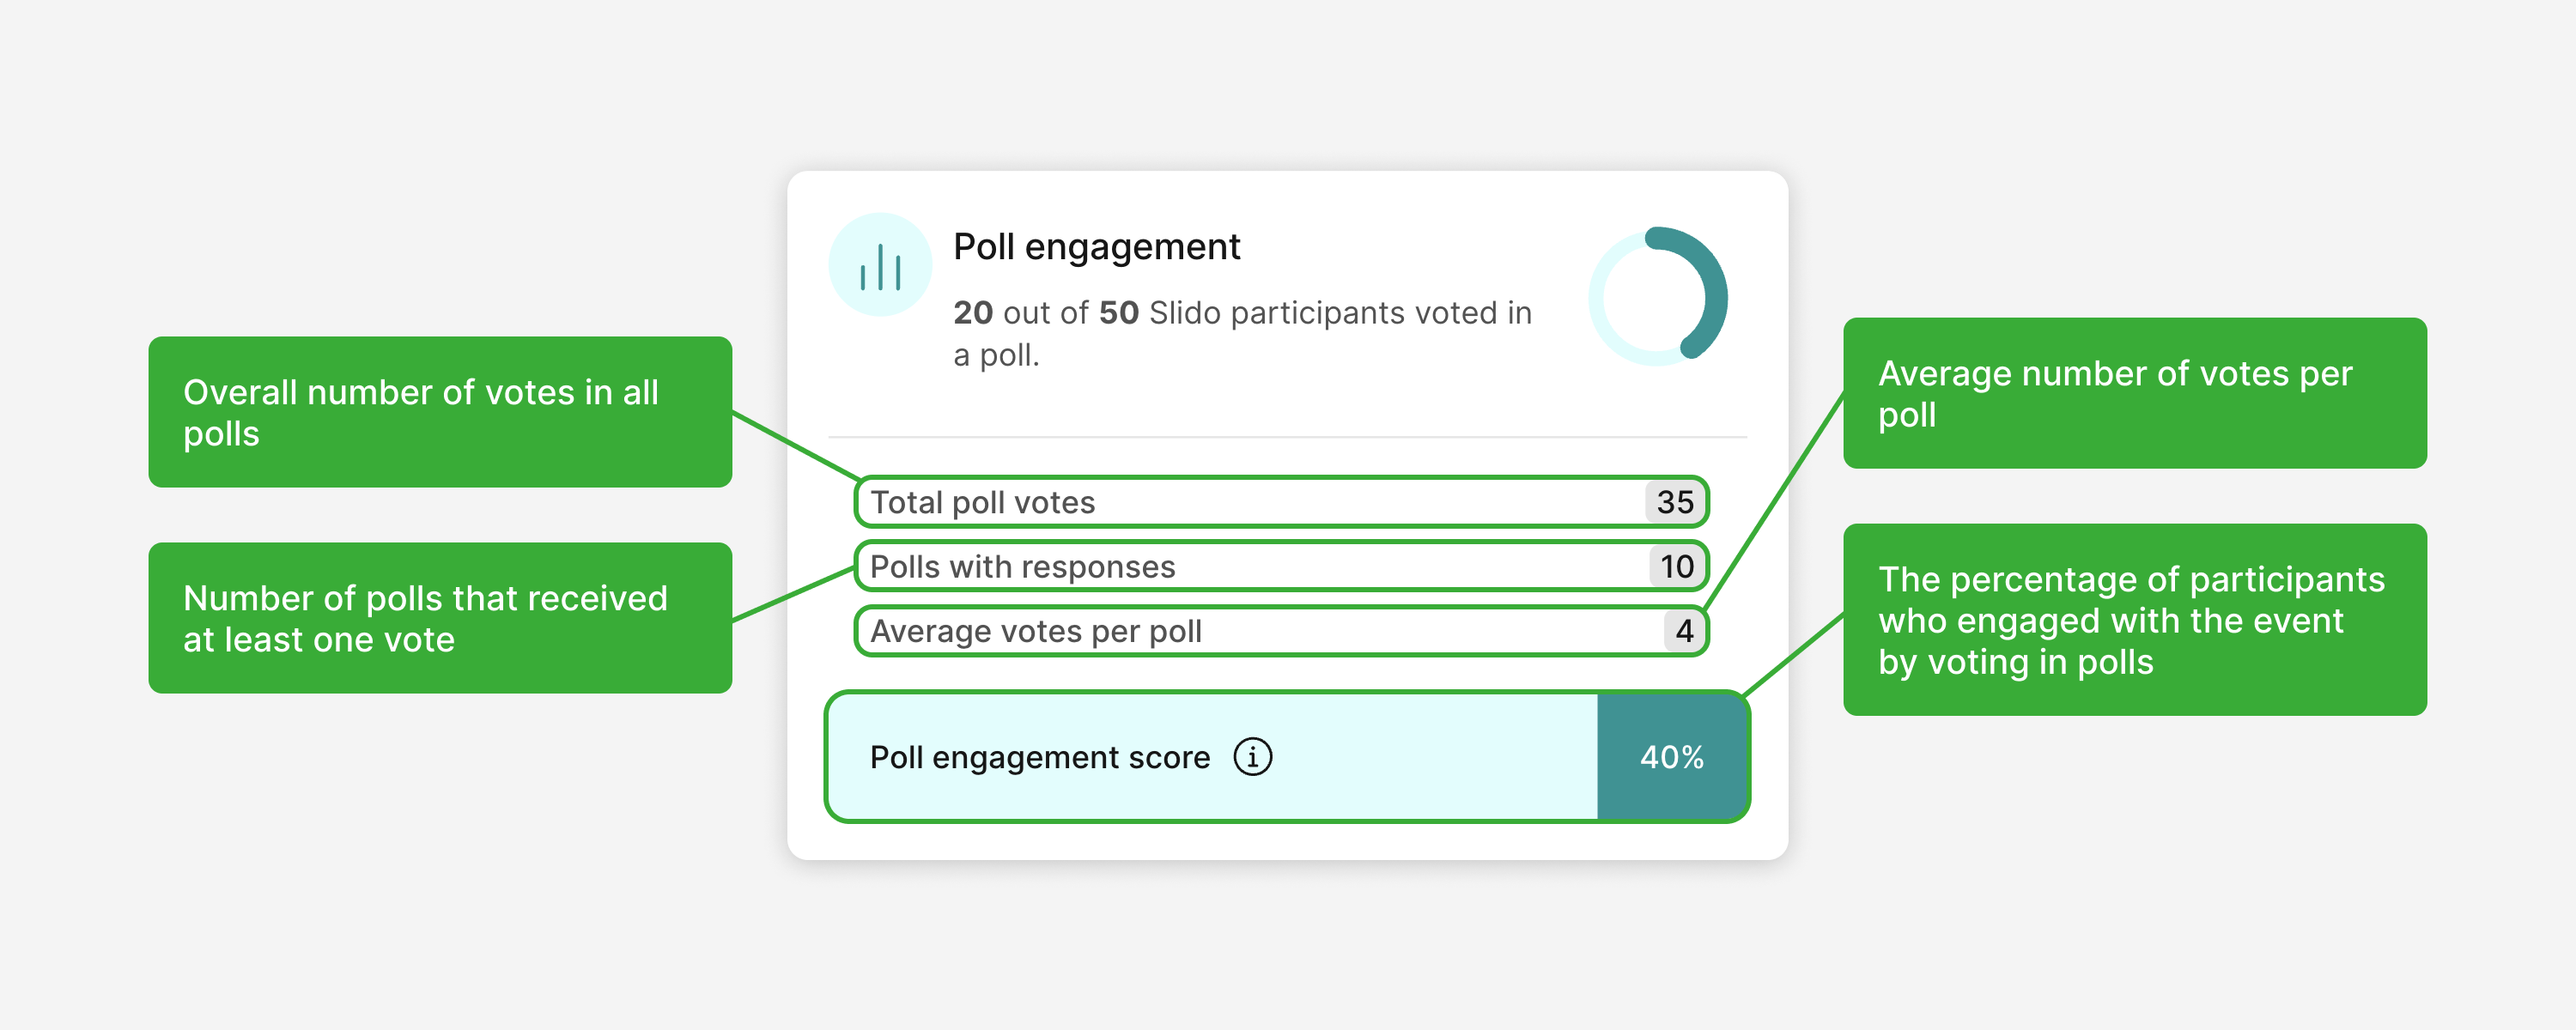
In this example, there were 35 votes in all polls, 10 polls received at least one vote and there were 4 votes in each poll on average. Out of all participants, 40% engaged with polls.
Q&A Insights
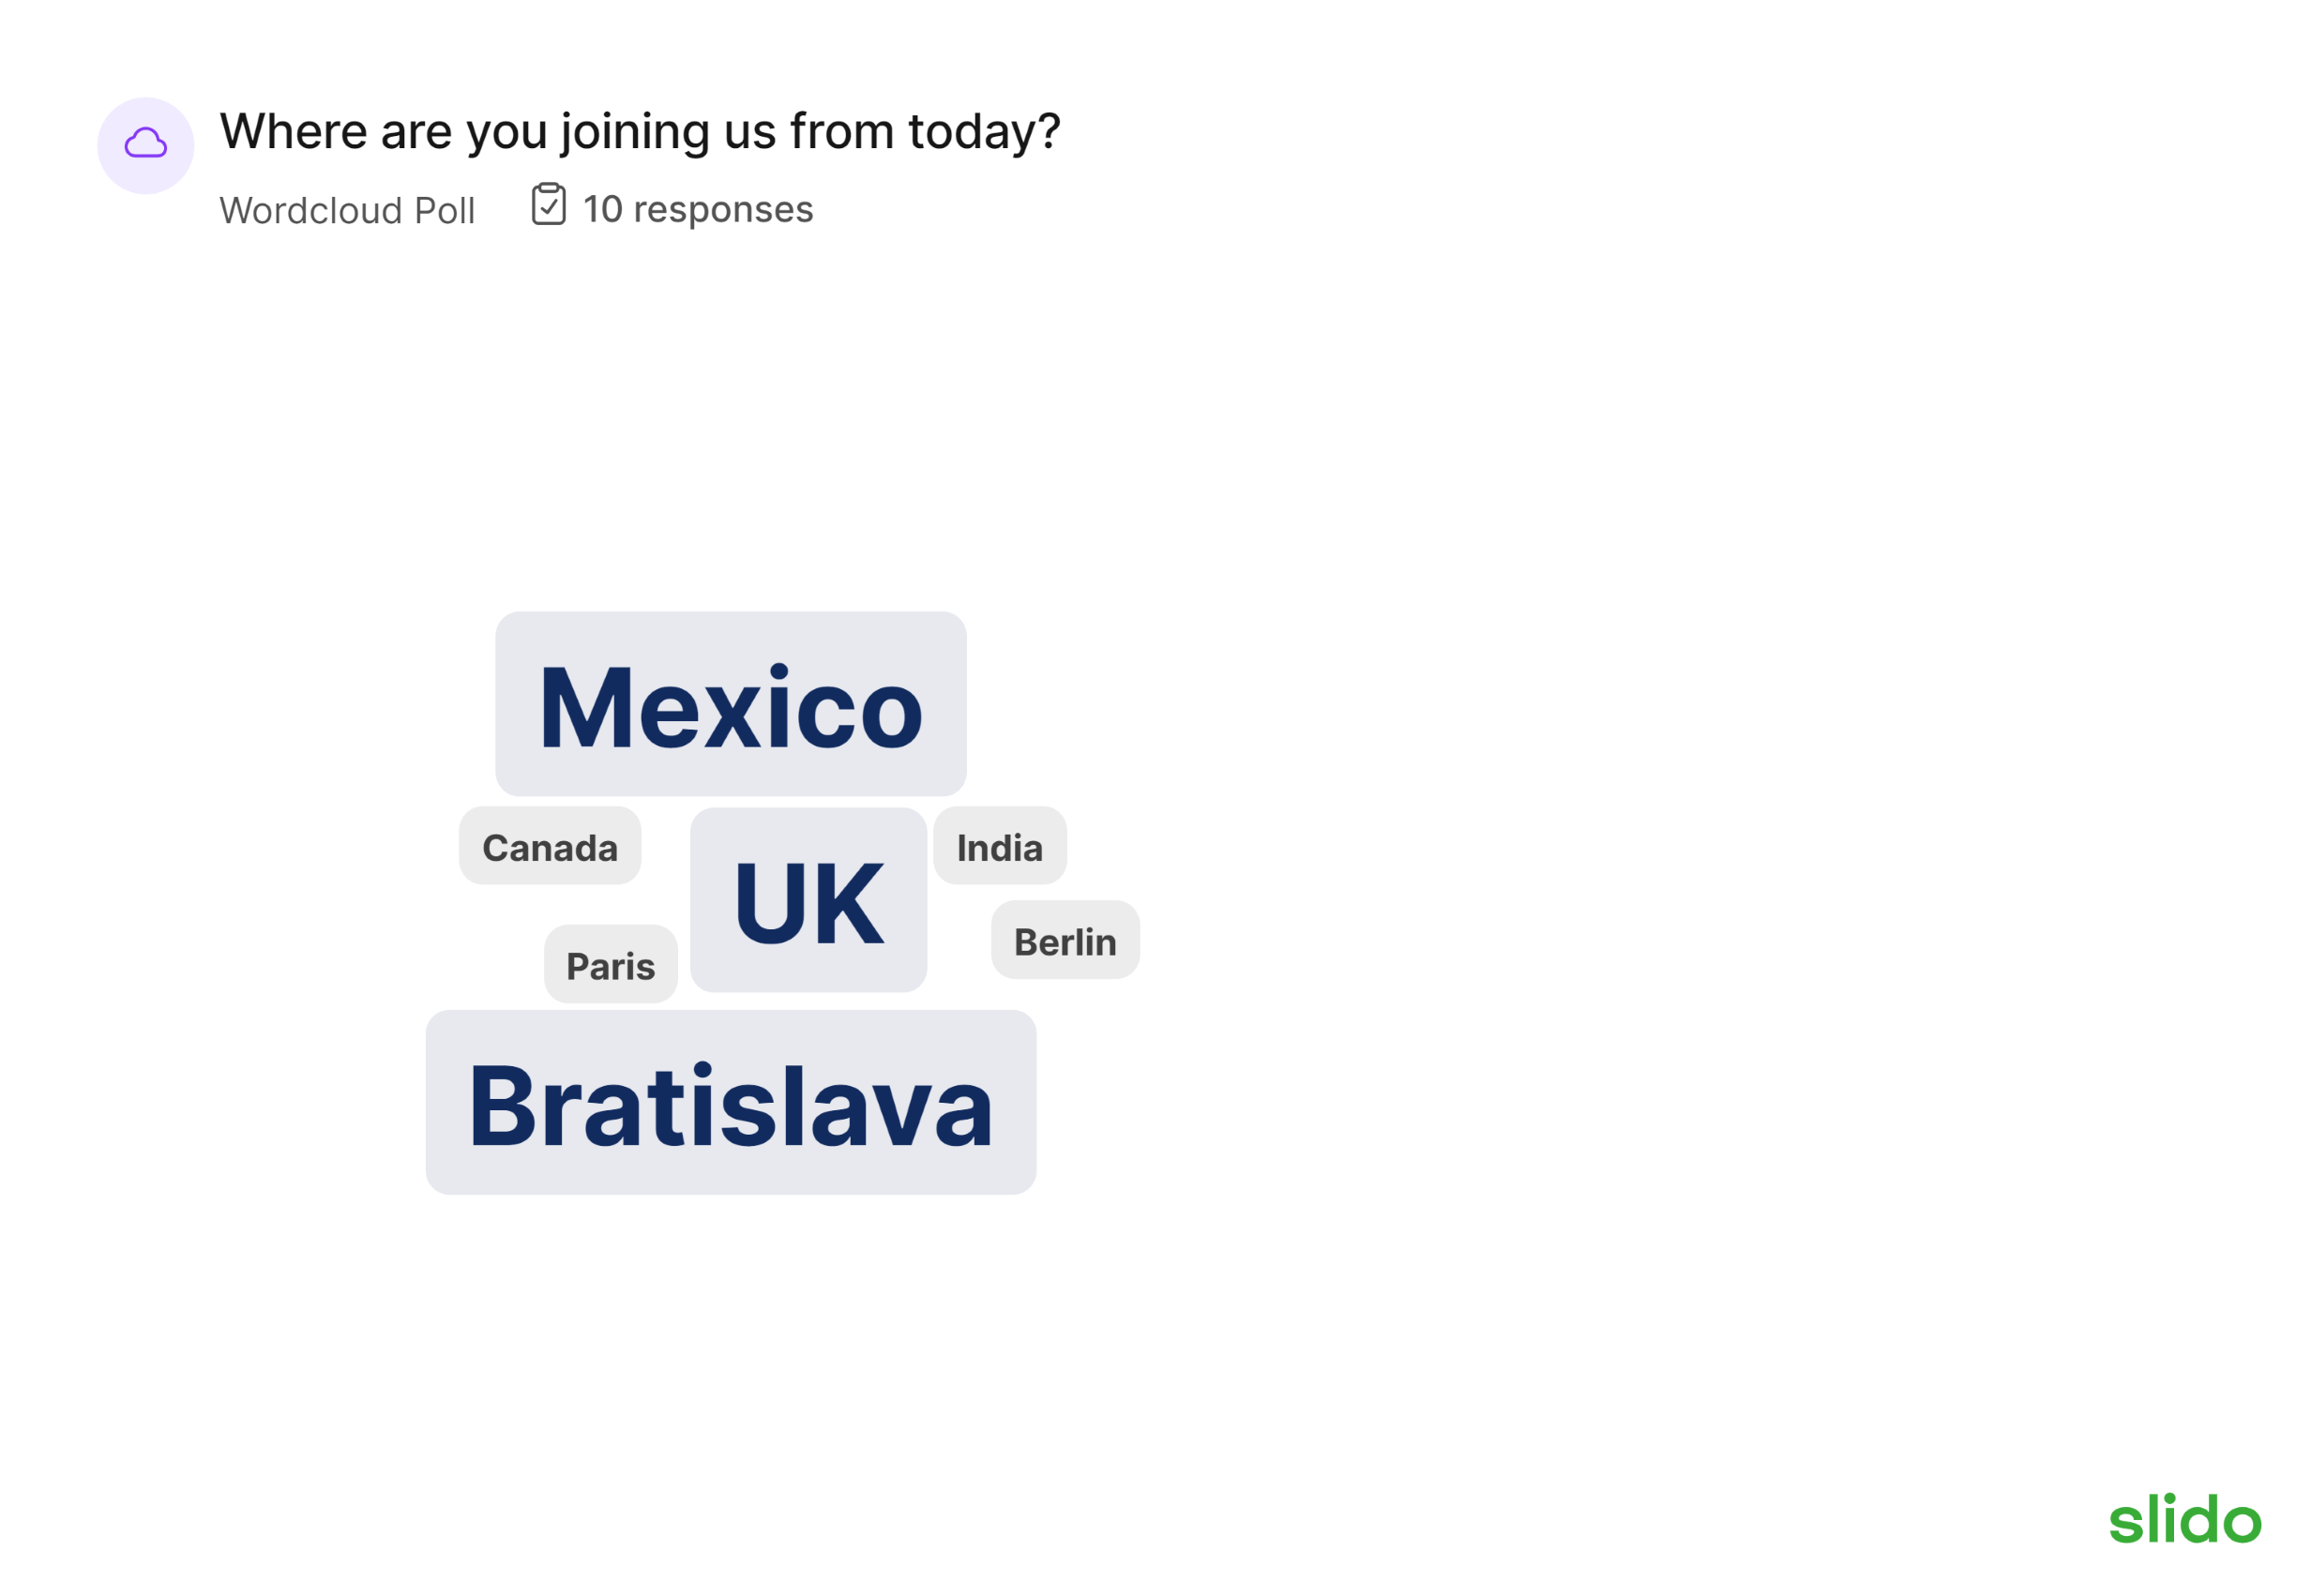
This section of the Analytics tab shows the most upvoted questions and generates a word cloud of the most popular topics mentioned at your event.
You can also analyze the sentiment of questions asked. Find out more here.
Poll Insights
This section of the Analytics tab shows a summary of insights from polls in the event.
You can now download your Insights as an image to share in presentations, ready to go with Slido branding.
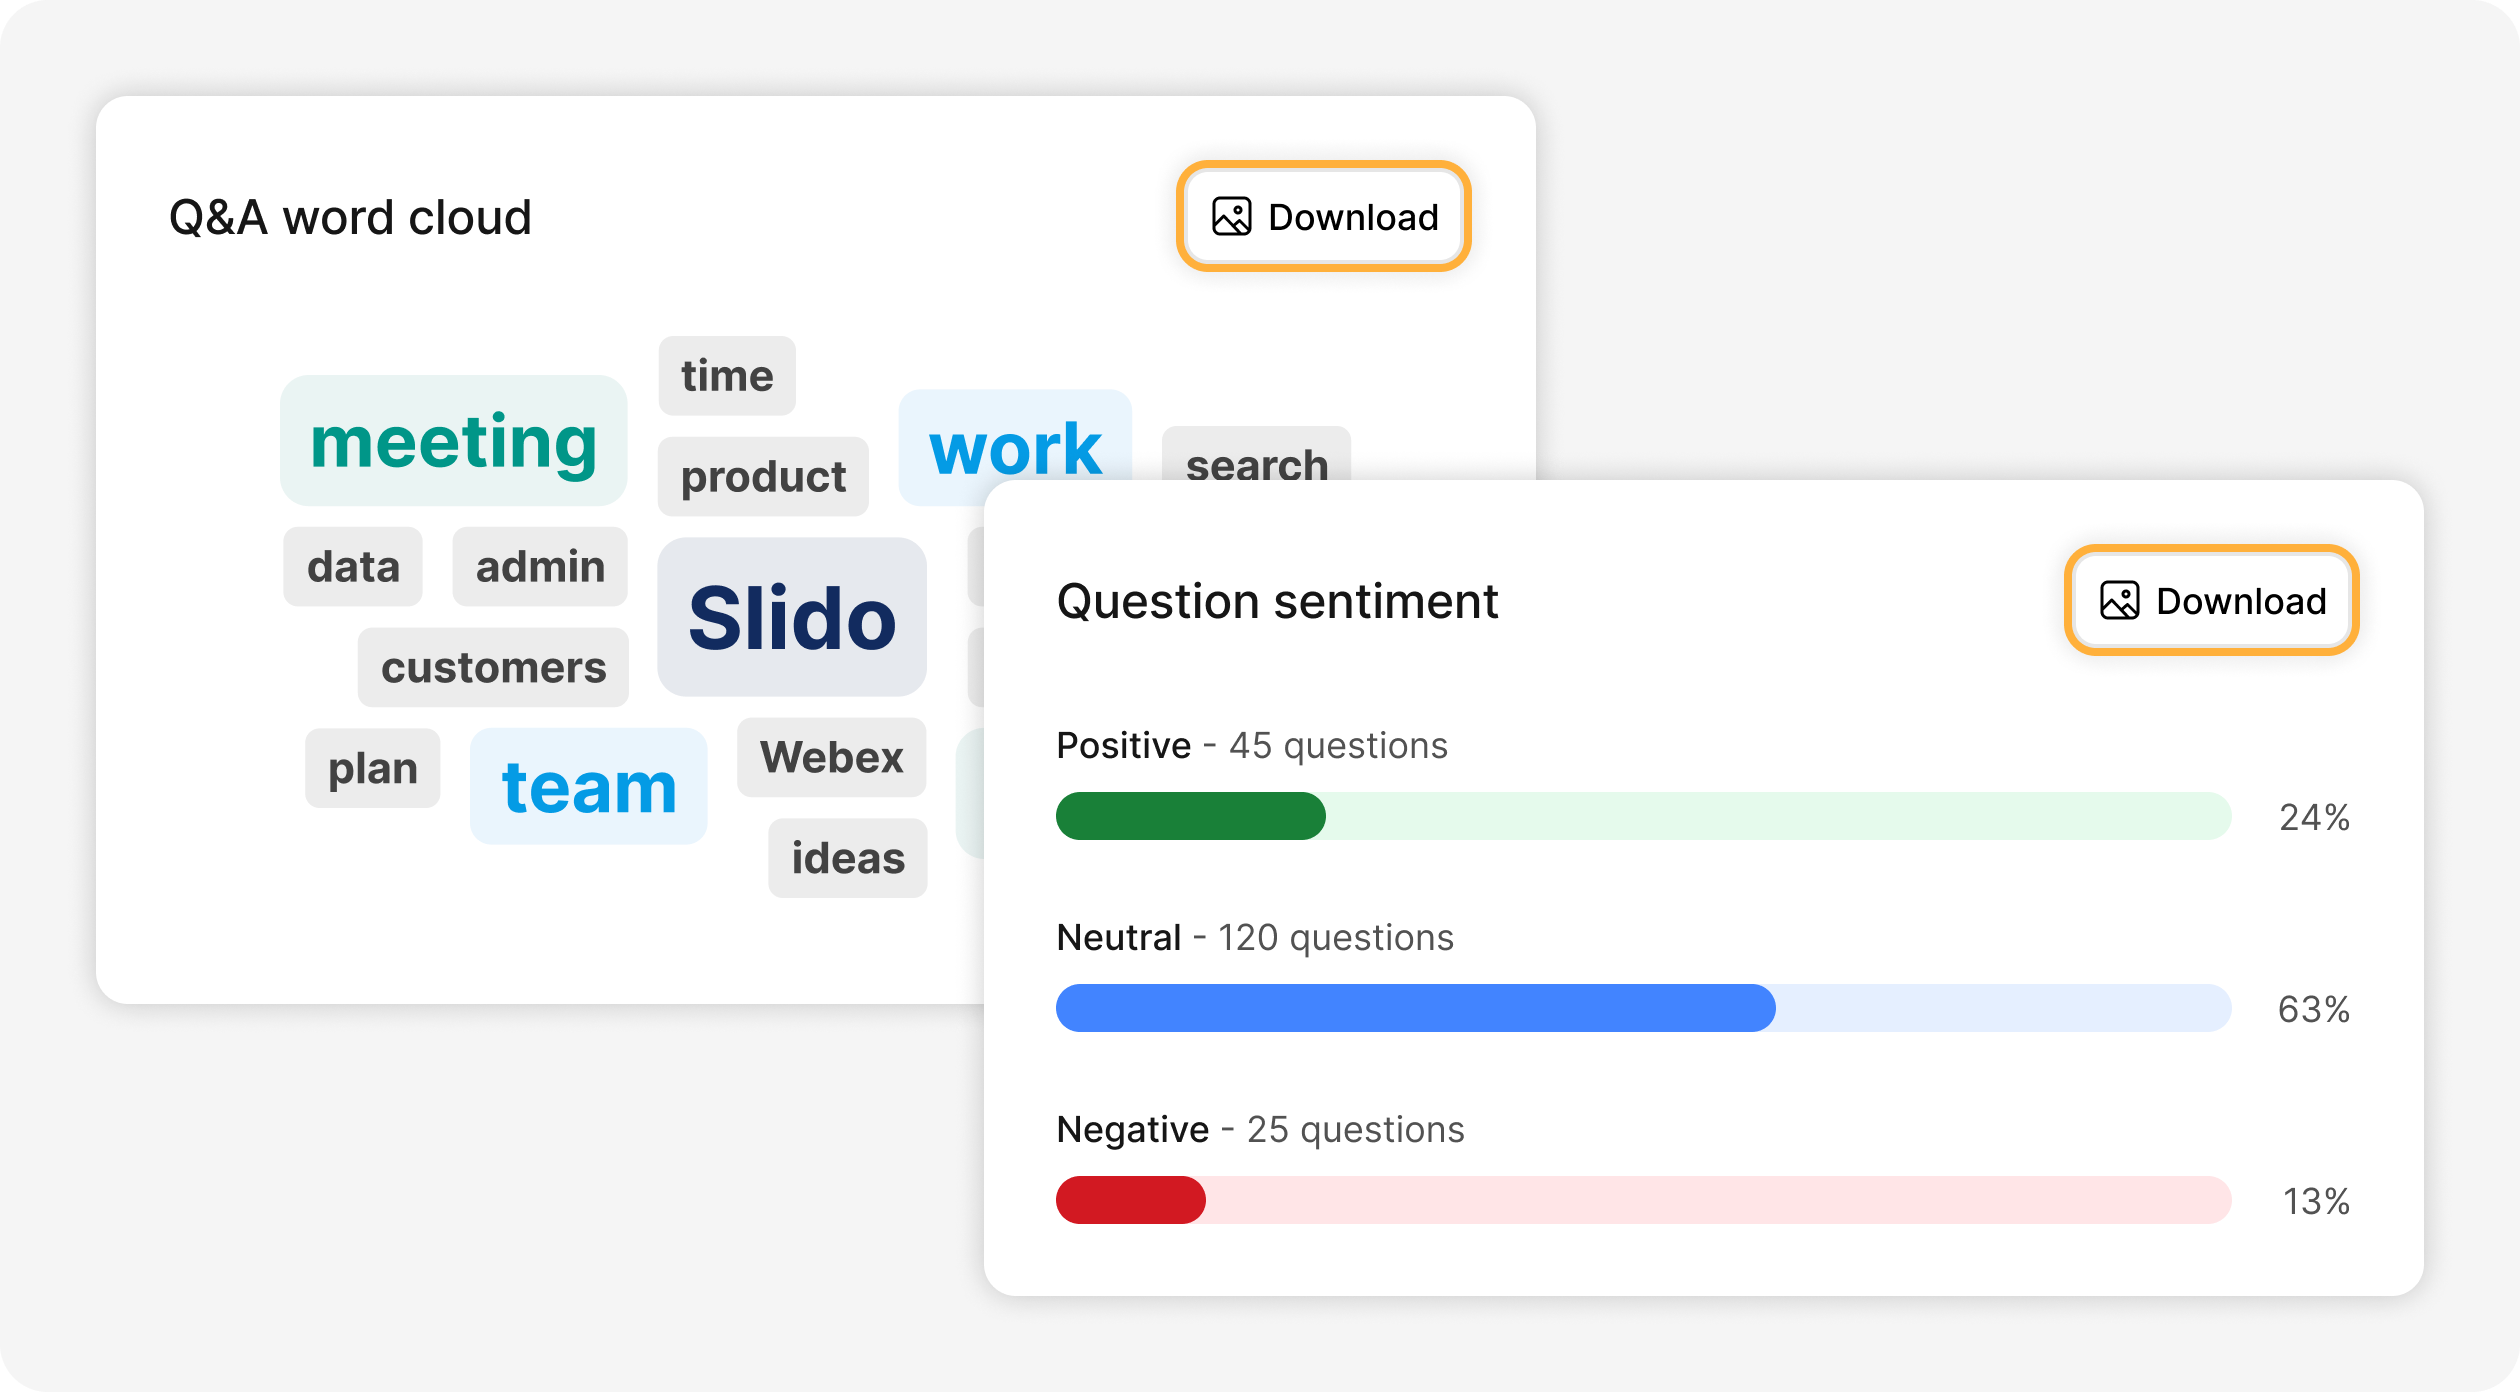
Download your Q&A Insights in an image
You can now easily download the images of your Q&A Word Cloud and the Question sentiment to share with other teams. This can be done by selecting the download button in the top right.
Copy image to Clipboard
You can easily insert your sentiments and word clouds into slide presentations, emails and even in messages to your colleagues by selecting Copy image to clipboard from the dropdown on your sentiment or word cloud images from the Analytics page.
Share Analytics in a Data Report
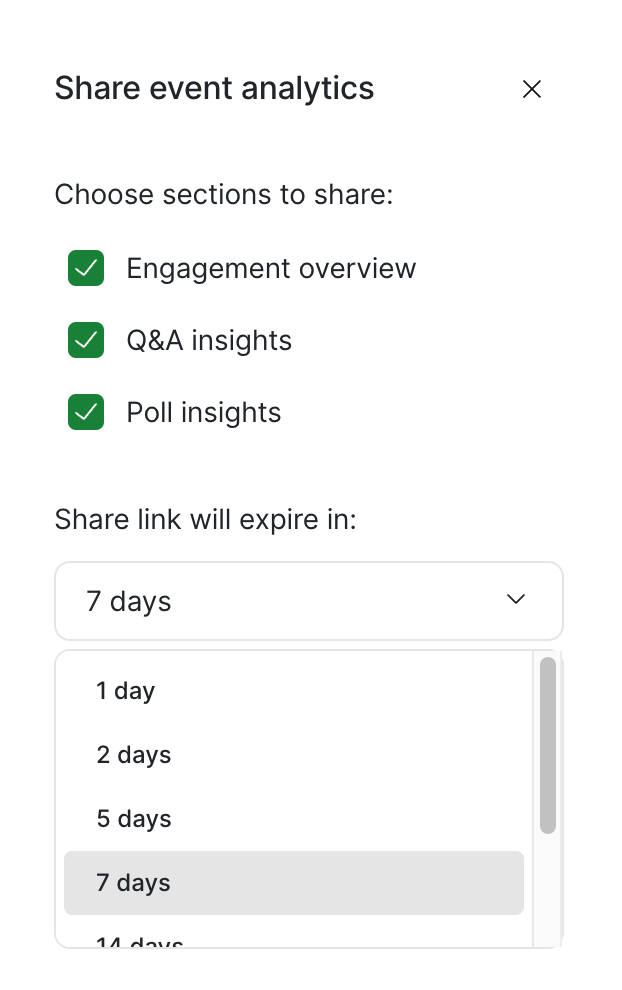
To format your data and analyze it further with your team, you can export it from the top of the Analytics page and even share a link that takes you directly to the data report.
You can set the number of days you’d like your share link to your Analytics to expire. You can select up to 60 days, giving your colleagues plenty of time to look at them.
Participants will not be able to access Analytics unless you share your report with them from admin. Any collaborators you have shared access to the event with in Slido can access Analytics.
Exporting analytics is only available on our paid plans.
Curious about more?