


We’re happy to share our latest rollout, Slido’s new Analytics with you, where you can improve your understanding and gain valuable insights of your meetings 📊
Our redesigned event Analytics lets you see how your meetings are performing. You can better understand how engaged your participants are, analyze trends in the data, and share the results with your team. With Analytics, you can now:
- Compare engagement levels across multiple meetings
- Discover trends behind the numbers and sentiment of your Q&A
- Quickly share your poll results and Q&A topics as images
We’ve introduced a fully redesigned page to help you make sense of the data you collect.
So, what kind of insights can you gain about your meetings?
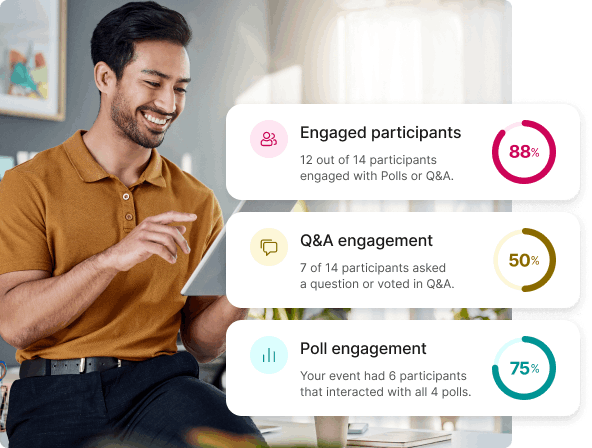
- Deepen your understanding of participant engagement, overall, in polls, and in Q&A sessions
- Explore trends in the data and get a sense of participant sentiment
- Create customizable data reports (previously known as infographics) to share the results via a link
Compare the success of your meetings from one to another while sharing important data with your team. Head to the Analytics tab of your most recent event and let us know what you think, we’re excited to hear your feedback!
👉Become an expert in Analytics and share your Data reports to understand valuable insights together👈
